JournoCon 2018: A Recap of our first data-driven conference
On March 24th, we hosted the JournoCon 2018. A data journalism bootcamp-slash-conference for students, freelance journalists and anyone wanting to learn more about the field. To those who were there: Thank you for making it an amazing day! To those who weren’t: Here’s a recap.

For beginners, it’s not always easy to get into data-driven work. You need skills you usually don’t learn in journalism schools, and in many newsrooms, there’s no infrastructure in place for journalists to augment their skills and connect with designers and developers. Still, what most journalists, in our experience, have, is motivation. What they generally do not have are
- time
- money.
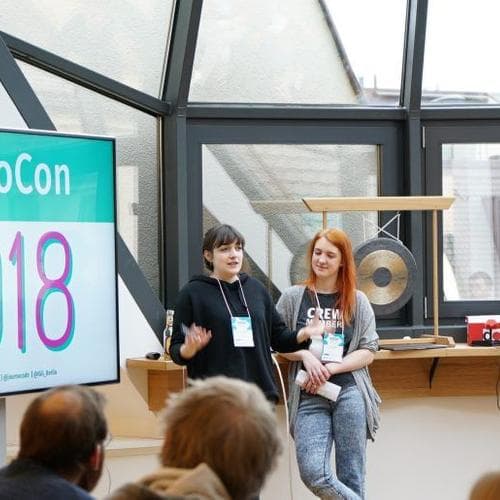
So, when planning our first ddj conference, we wanted to make it affordable, even for students and trainees. You can’t teach everything there is to know about data-driven journalism in a day, of course. But we wanted to give learners a starting point, an overview of the steps involved. Basically: If people knew what to google when they got home, we would have done our job for the day. The result – after three months of planning – is the JournoCon 2018: one day, 60 participants, 7 squirrels, 5 amazing speakers from data journalism teams around Germany. We held it in German, so the slides and resources we’ll link to at the bottom aren’t available in English at the moment. But we’ll have more events, no doubt. For now, those of you who don’t speak German will have to make do with this recap, though.
The conference was structured around the data-driven workflow:

This is the simplified version, of course, but it’ll work for our purposes. So, we organized the conference into five blocks, corresponding to the five main steps in working with data. For each block, there were two tracks:
- A keynote track with two half-hour segments: Talks, discussions and presentations on aspects of the workflow step
- A workshop track with one hour-long course for those who want to try the hands-on approach to ddj.
Thanks to our amazing host, the Infographics Group, the conference took place in a beautiful space in the heart of Berlin. We were also happy to have some of our other supporters present at the conference. For our introduction, we decided to play a little warm-up game to get talking about data-driven journalism.
Finding Ideas
For our first segment, we invited leaders from German ddj teams to talk about their process of coming up with ideas. Did you know that, in many cases, data journalism teams are also the ones bringing new technologies to the rest of their newsrooms? Thanks so much to Christina Elmer (Spiegel Online), Götz Gringmuth (rbb) and Michael Kreil (Infographics Group) for participating.
Researching Data
Michael Hörz, data journalist at rbb and ddj lecturer, held the first workshop of the day: For some hands-on data research, he gave an overview of data sources available in Germany (You can find his slides here). In the meantime, our Sophie Rotgeri gave a short introduction to data sources in the keynote track as well, supplemented by an introduction to scraping from our hacker-in-chief, Sakander Zirai. If you want to try some hands-on scraping yourself, check out our tutorial on how to scrape a website with Python, R and the tool import.io.
Cleaning messy data
First things first: What is clean data, anyway? In his talk, Journocode squirrel Moritz Zajonz explained what “readable” means to a machine versus a human, and why CSVs and Excel often don’t get along. And cleaning data can be especially tricky when dealing with large amounts of it, as Vanessa Wormer, leader of the Süddeutsche Zeitung data team, knows from her work on the Panama Papers and the Paradise Papers. In her keynote, she presented the most helpful tools to deal with big datasets. For those who wanted to dig into data right away, Kira Schacht held a workshop on how to use Open Refine for data cleaning.
Analyzing data
When Journocode started out, our main goal was to teach each other about data analysis in the statistical programming language R. We haven’t forgotten our roots, so of course, the JournoCon featured an R crash course held by our founder Marie-Louise Timcke.
But R is far from the only thing journos can learn about analyzing data: In the keynote track, Moritz Zajonz gave an overview of the key lessons every journalist should know about statistics, and our computer scientists Elena Erdmann and Sakander Zirai talked about how to use machine learning methods in a journalistic way.
Data Visualization
Finally, we were glad to have Lisa Charlotte Rost on board with a workshop on Datawrapper, a data visualization tool designed to be used in the newsroom. As for talks, we wrapped up the day with a look into the hottest trends in dataviz: Phillip Hafellner of Infographics Group talked all things AR, VR and Gamification. While opening the first beers of the evening, we ended on a little contest: In “painting by numbers”, our participants had five minutes to create a visualization for a dataset they had just learned about. And they came up with some amazing ideas!
To JournoCon 20XX… and beyond!
It was great fun seeing so many motivated people come together. All in all, we’re definitely doing this again! We also got some really helpful feedback from attendees after the conference. We’re going to take all of it to heart for JournoCon 20XX, the main points being:
- more space for workshops
- longer and more pauses
- more time for networking. Turns out, journalists really like talking to each other.
Some people asked for more in-depth ddj talks, others were glad we kept it simple, still others thought some points were too specific already. We definitely want to keep the JournoCon beginner-friendly, but we’d also love to give more advanced people the opportunity to talk shop. Maybe that’s going to mean a longer conference, maybe it means more tracks tailored to different levels of expertise. Maybe we’re going to organize more mini-conferences with more in-depth scopes – we don’t know yet. What we do know is that we’re only just getting started.
You can find our conference pad here. It contains links to all our presentations, as well as further resources for many of the conference’s talks and workshops. For more impressions from the conference, be sure to check out the contents of #JournoCon18 on twitter. The complete program and more information on the speakers can also be found on the conference website.
On the website, you’ll also find more info on our supporters, without which the JournoCon 2018 would not have been possible. Special thanks go to Infographics Group Berlin for providing location and logistics.